Trading View
Last updated: 2026-03-12
The token chart uses TradingView, so you get familiar charting tools without leaving the platform. Candles, indicators, drawing tools, and trading overlays all stay in the same place as your execution panel, turning the page into a live command view.
Market Data And View Toggles
You can change how market data is displayed depending on how you read the market:
- Switch price and market cap between
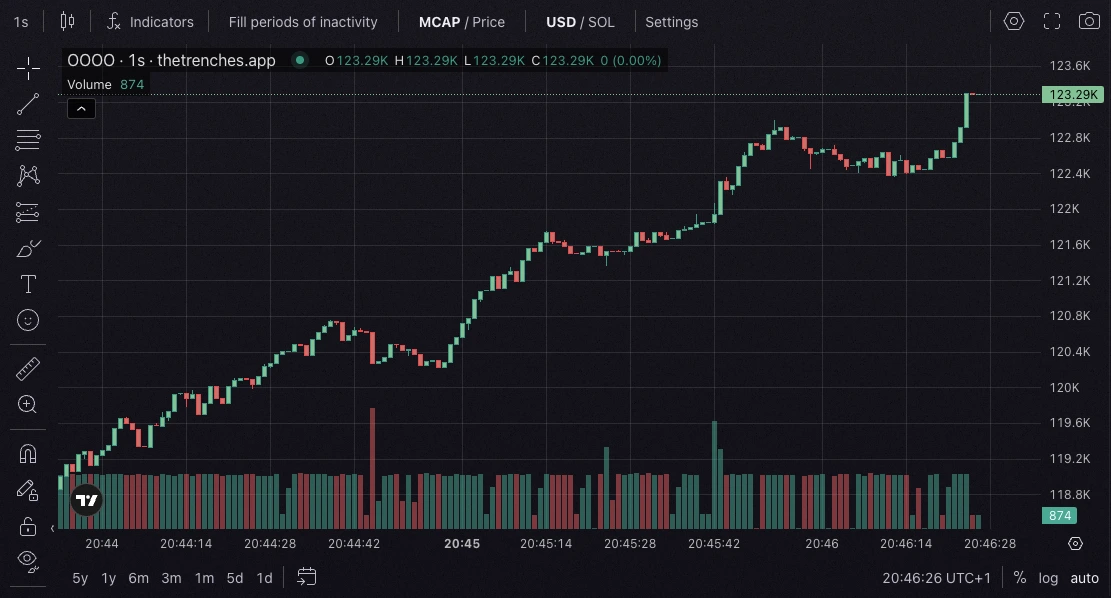
USDandSOL. - Turn
Fill periods of inactivityon or off depending on whether you want a continuous chart or a stricter view of trading activity.
Order Lines And Position Marks
The chart also shows your execution context directly on screen:
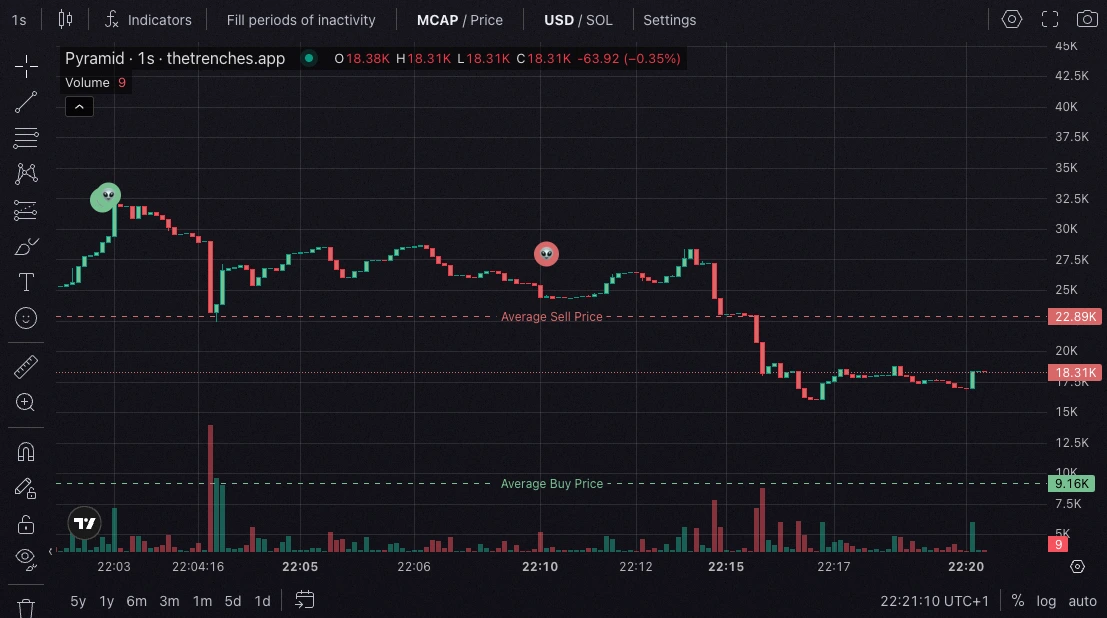
- Active limit orders appear as draggable lines, so you can adjust trigger levels from the chart.
- Entry and exit markers help you see where your position was built and reduced over time.
On-Chain Marks
TradingView also displays useful on-chain intel as chart marks:
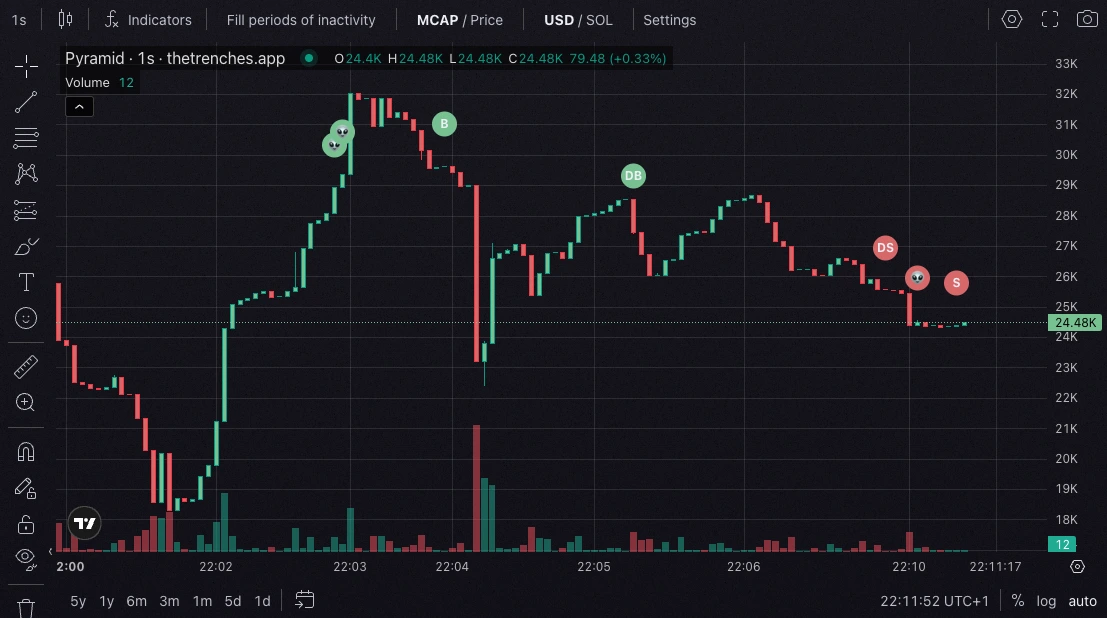
- Creator marks show when the token creator buys or sells.
- Your own buys and sells are marked so you can review timing at a glance.
- Watchtower marks can show trades from wallets you track.
Migration And Launchpad Milestones
For launchpad tokens, the chart can also highlight important lifecycle points:
- A migration goal line shows the level needed to complete the bonding curve.
- A migration mark shows when the token moved from the launchpad phase to the DEX.
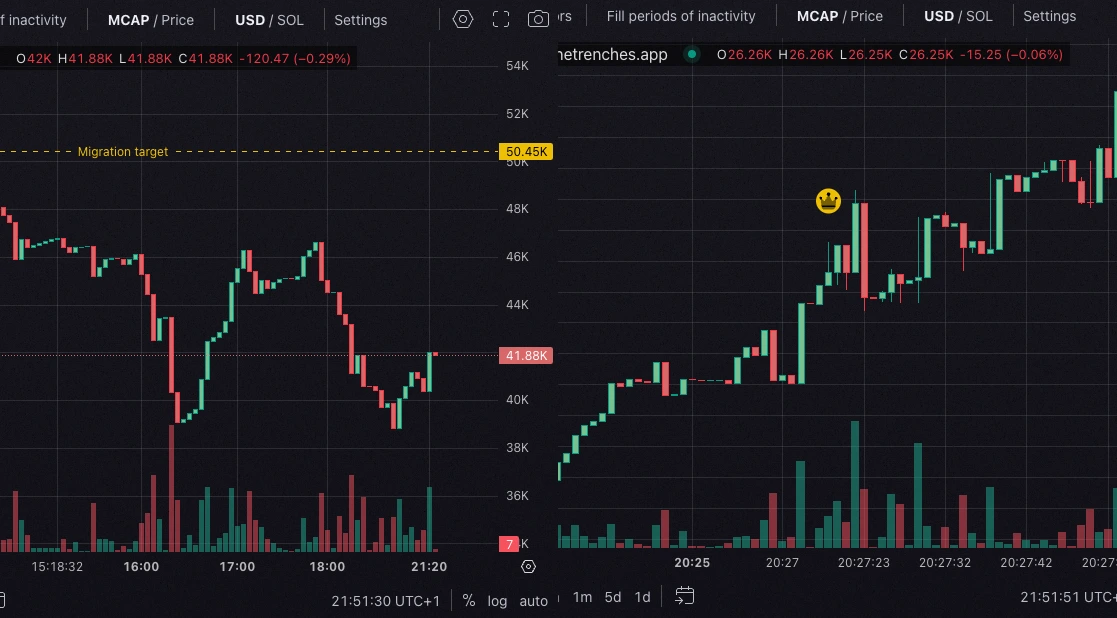
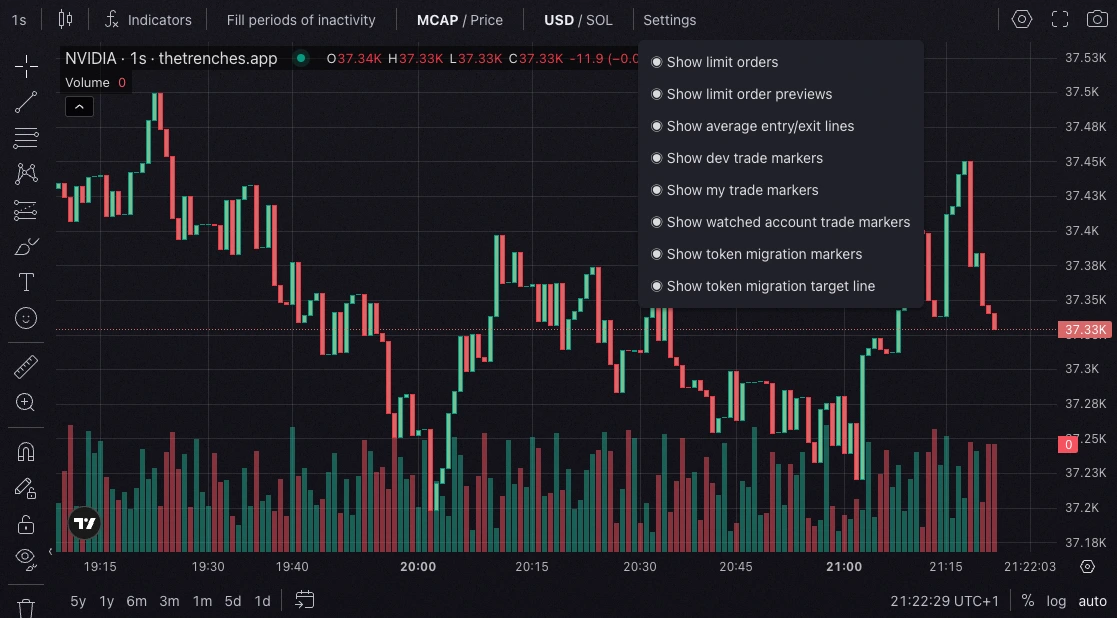
Chart Settings
Most overlays and marks can be turned on or off in Chart Settings, so you can keep the chart focused on the intel you actually use.